Writing Code for a
Cleaner Energy Grid
July 2023
In the global transition to clean electricity, code plays an increasingly pivotal role. Yet, the connection between code, energy, and emissions isn’t well understood by most. To paint a clearer picture, we discuss how energy moves in the grid, an emerging problem with renewables, the rise of energy storage, and how code ties all of these together.
Understanding the Grid from Power Outlet to Power Plant
Discussing the technical challenges, opportunities, and market for clean energy aren’t possible without a baseline understanding of how the grid actually works. Let’s start by working backwards from a power outlet in a home, to power plants in the grid.
How does clean energy in the grid actually reach a power outlet?
Energy supplied to power outlets in homes, apartments, and businesses comes from a utility. That utility doesn’t actually generate the energy they’re sending to customers, though. They buy it from the wholesale electricity market.
Utilities buy the energy for their customers from the wholesale electricity market.
On the other side of the wholesale electricity market are power plants, which are owned by private companies called independent power producers (IPPs), utilities, or government agencies. These power plants sell energy to the wholesale electricity market.
Energy in the wholesale electricity market primarily comes from a mix of privately-owned and utility-owned power plants.
Understanding the wholesale electricity market lets us understand the movement of energy within the grid. But, how does the electricity market determine which energy gets to flow through the grid?
Supply comes from power plants and demand comes from utilities buying power for their residential and commercial customers.
Operating the Electricity Market: Balancing Supply & Demand
Imagine the grid as a tank of water. At one end of the tank is an inlet representing supply, and on the other end is an outlet representing demand. For the grid to function, the water level in the tank has to stay within a certain range all the time, even with fluctuating amounts of water constantly coming into and out of the tank. If supply and demand misalign in the grid, it can lead to equipment damage, blackouts, or other system-wide reliability issues.
Operating the grid is similar to keeping a tank of water filled to a certain level.
In reality, both supply and demand are constantly changing, driven by a few key factors:
Supply is increasingly dynamic as the grid shifts to renewable energy (like wind and solar). These resources are dependent on how much sun is shining or wind is blowing, and aren’t always on.
Demand fluctuates throughout the day as people wake up, go to-and-from work, and come home in the evening. Imagine the collective sum of millions of different things plugged into power outlets constantly switching between on and off throughout the day.
Where Supply Comes From—in Pictures and Numbers
We’re in the early days of a massive clean energy transition in the grid. Smaller, intermittent renewables like wind and solar are rapidly replacing generation that would have come from large coal, natural gas, nuclear, and hydroelectric power plants. This is crucial to solving climate change, but the transition is not without its challenges.
Before diving into the numbers, though, one may wonder what these power plants actually look like. The gallery below shows some of the most common types of power plants:
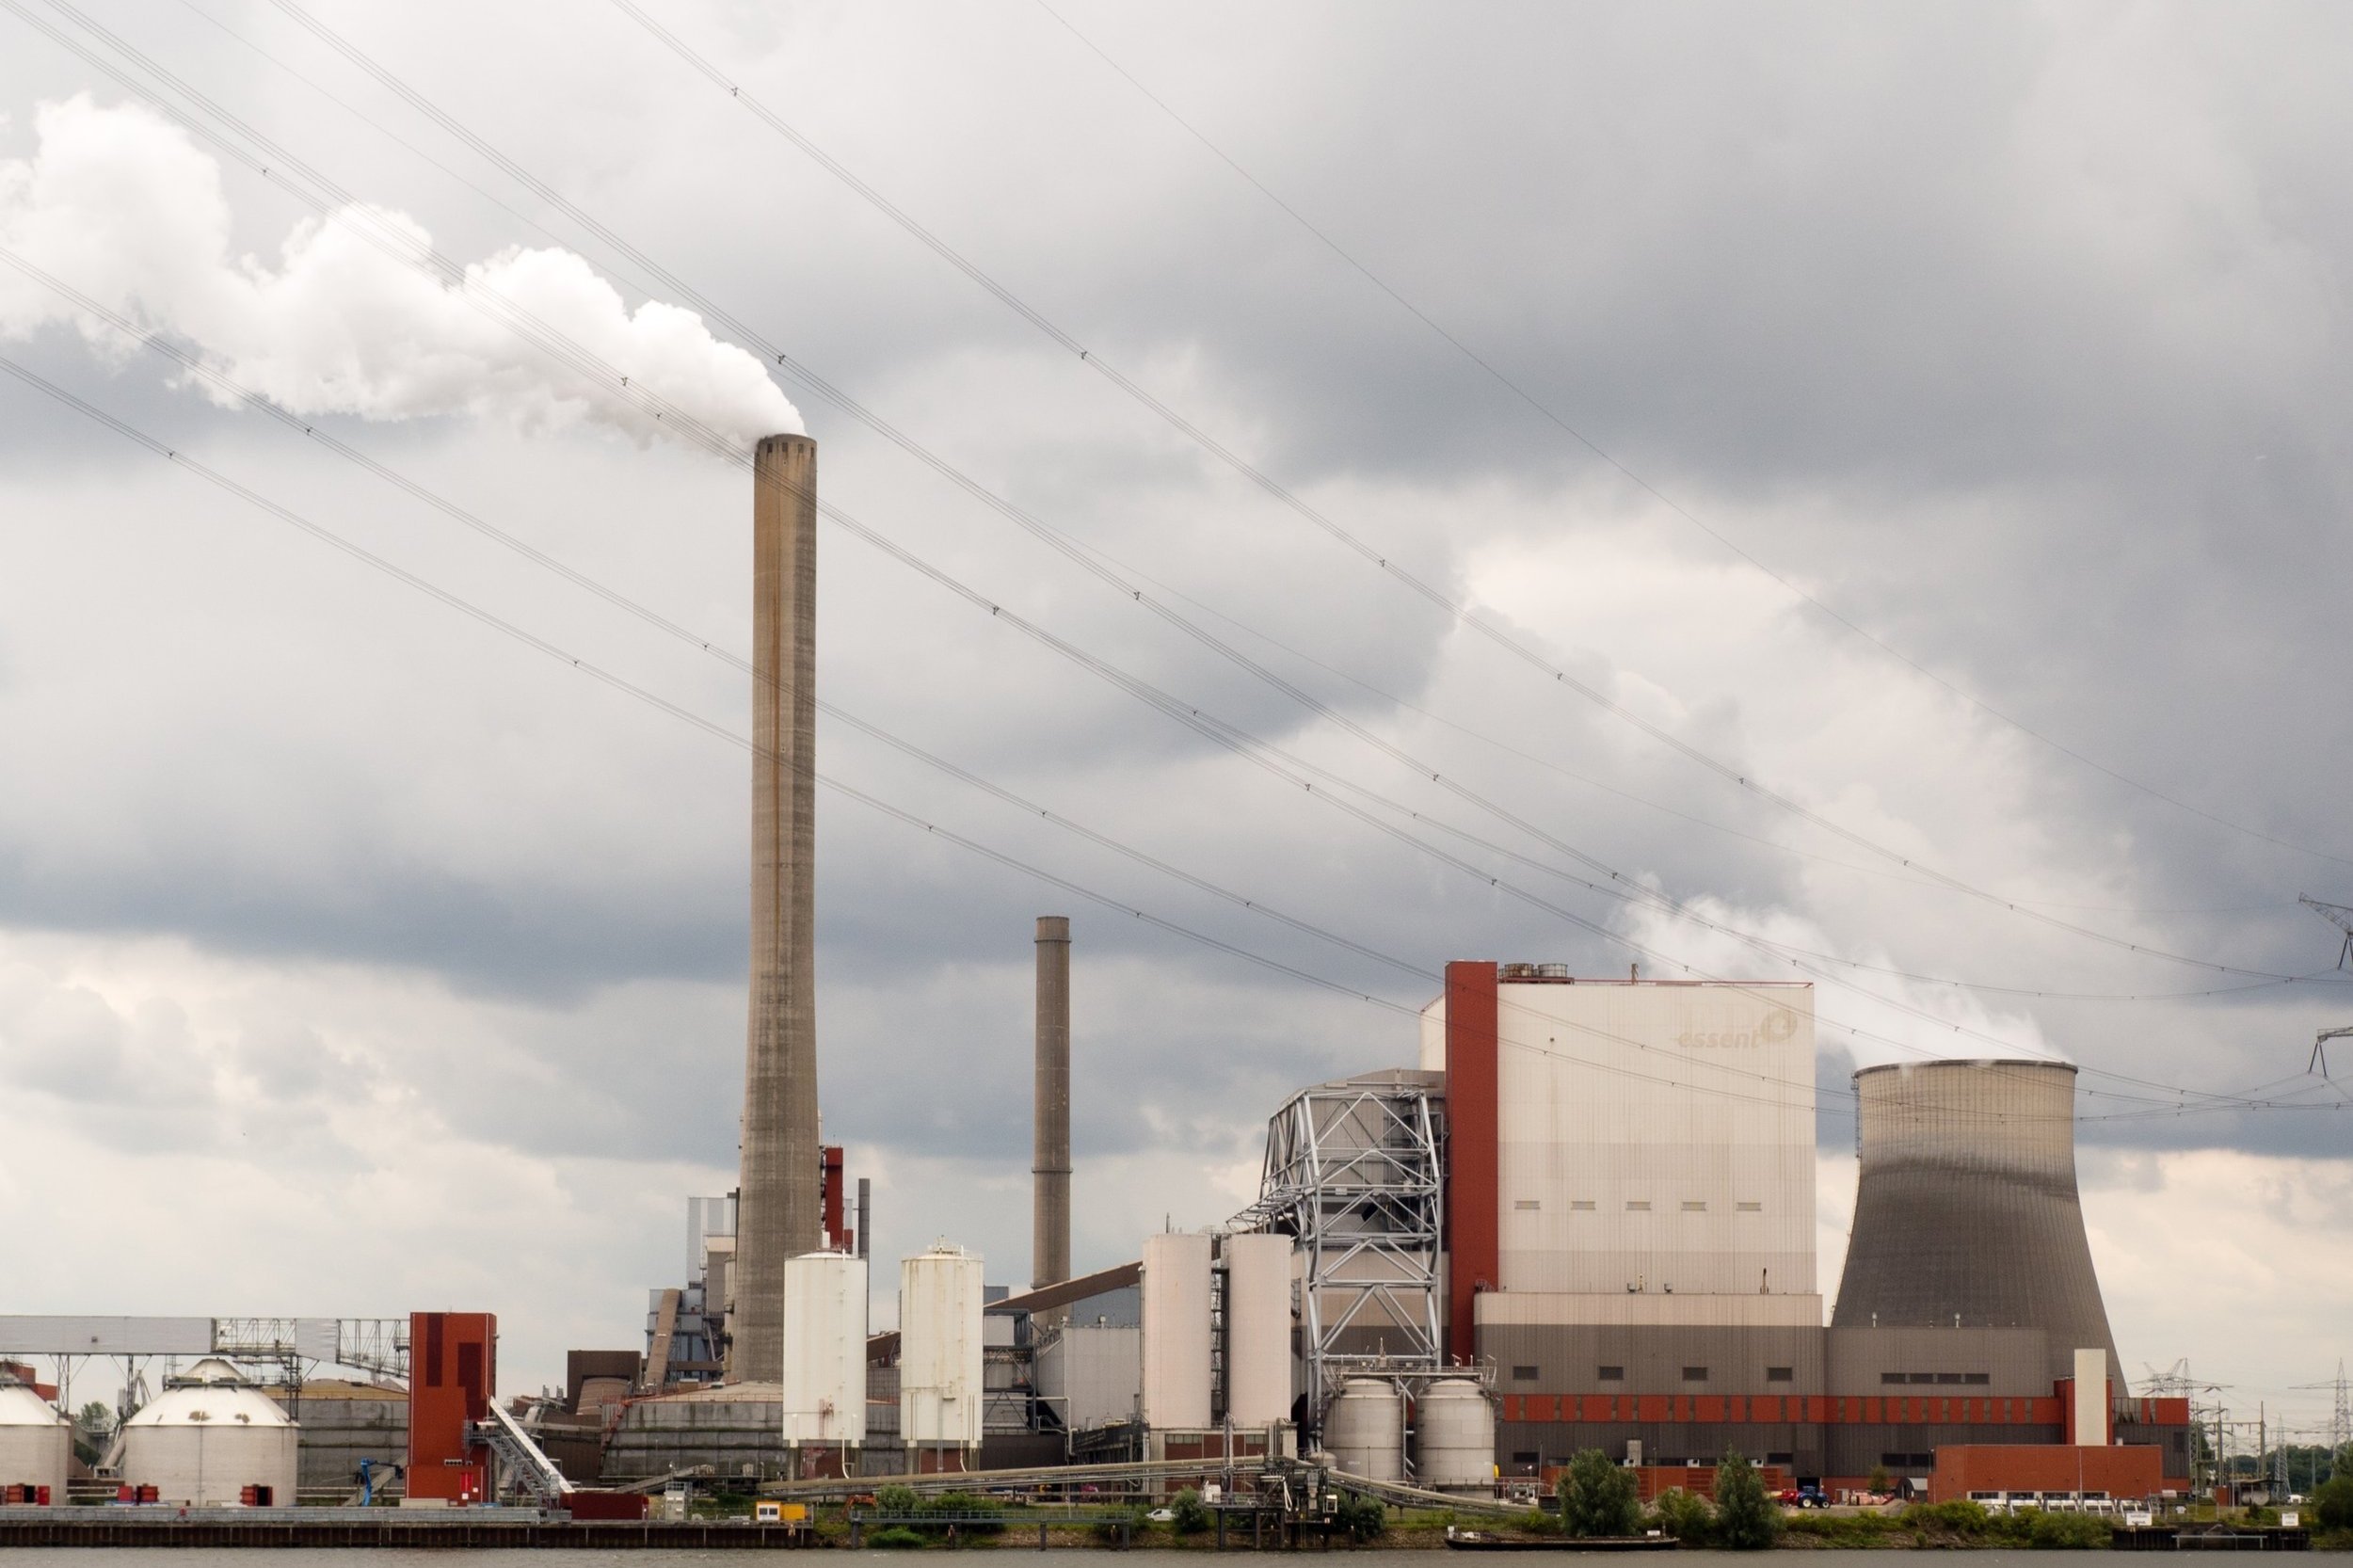
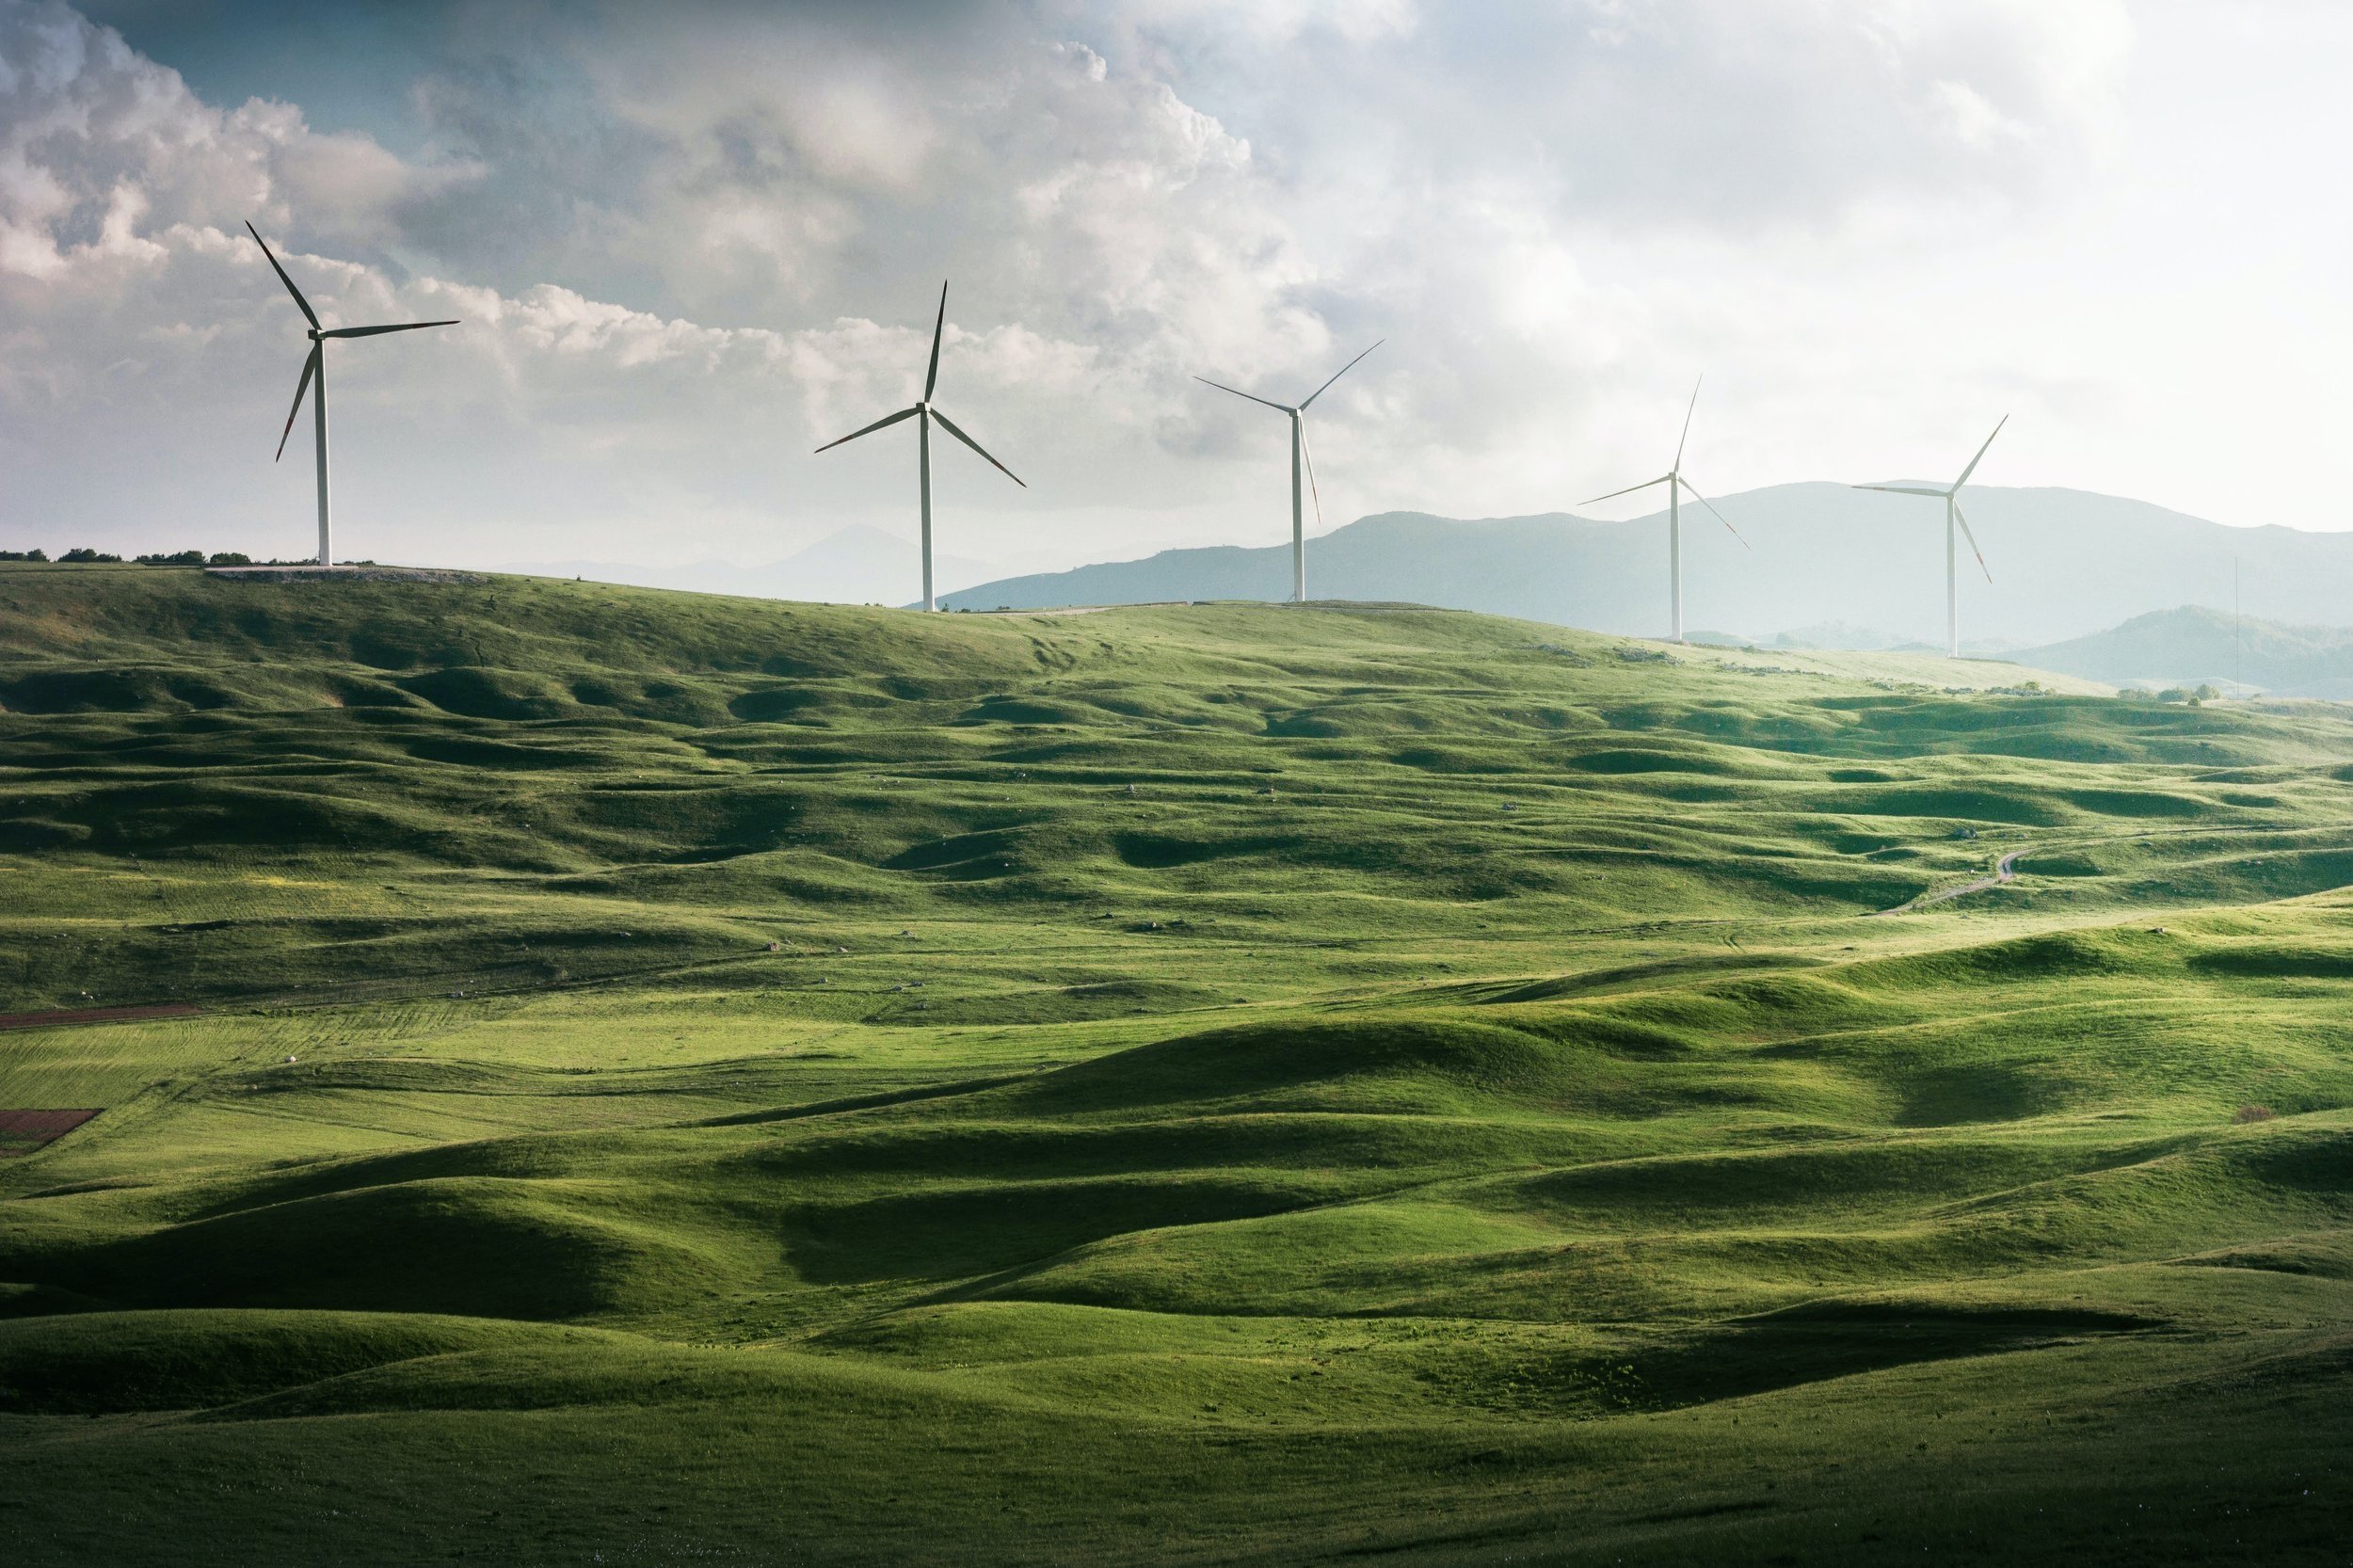
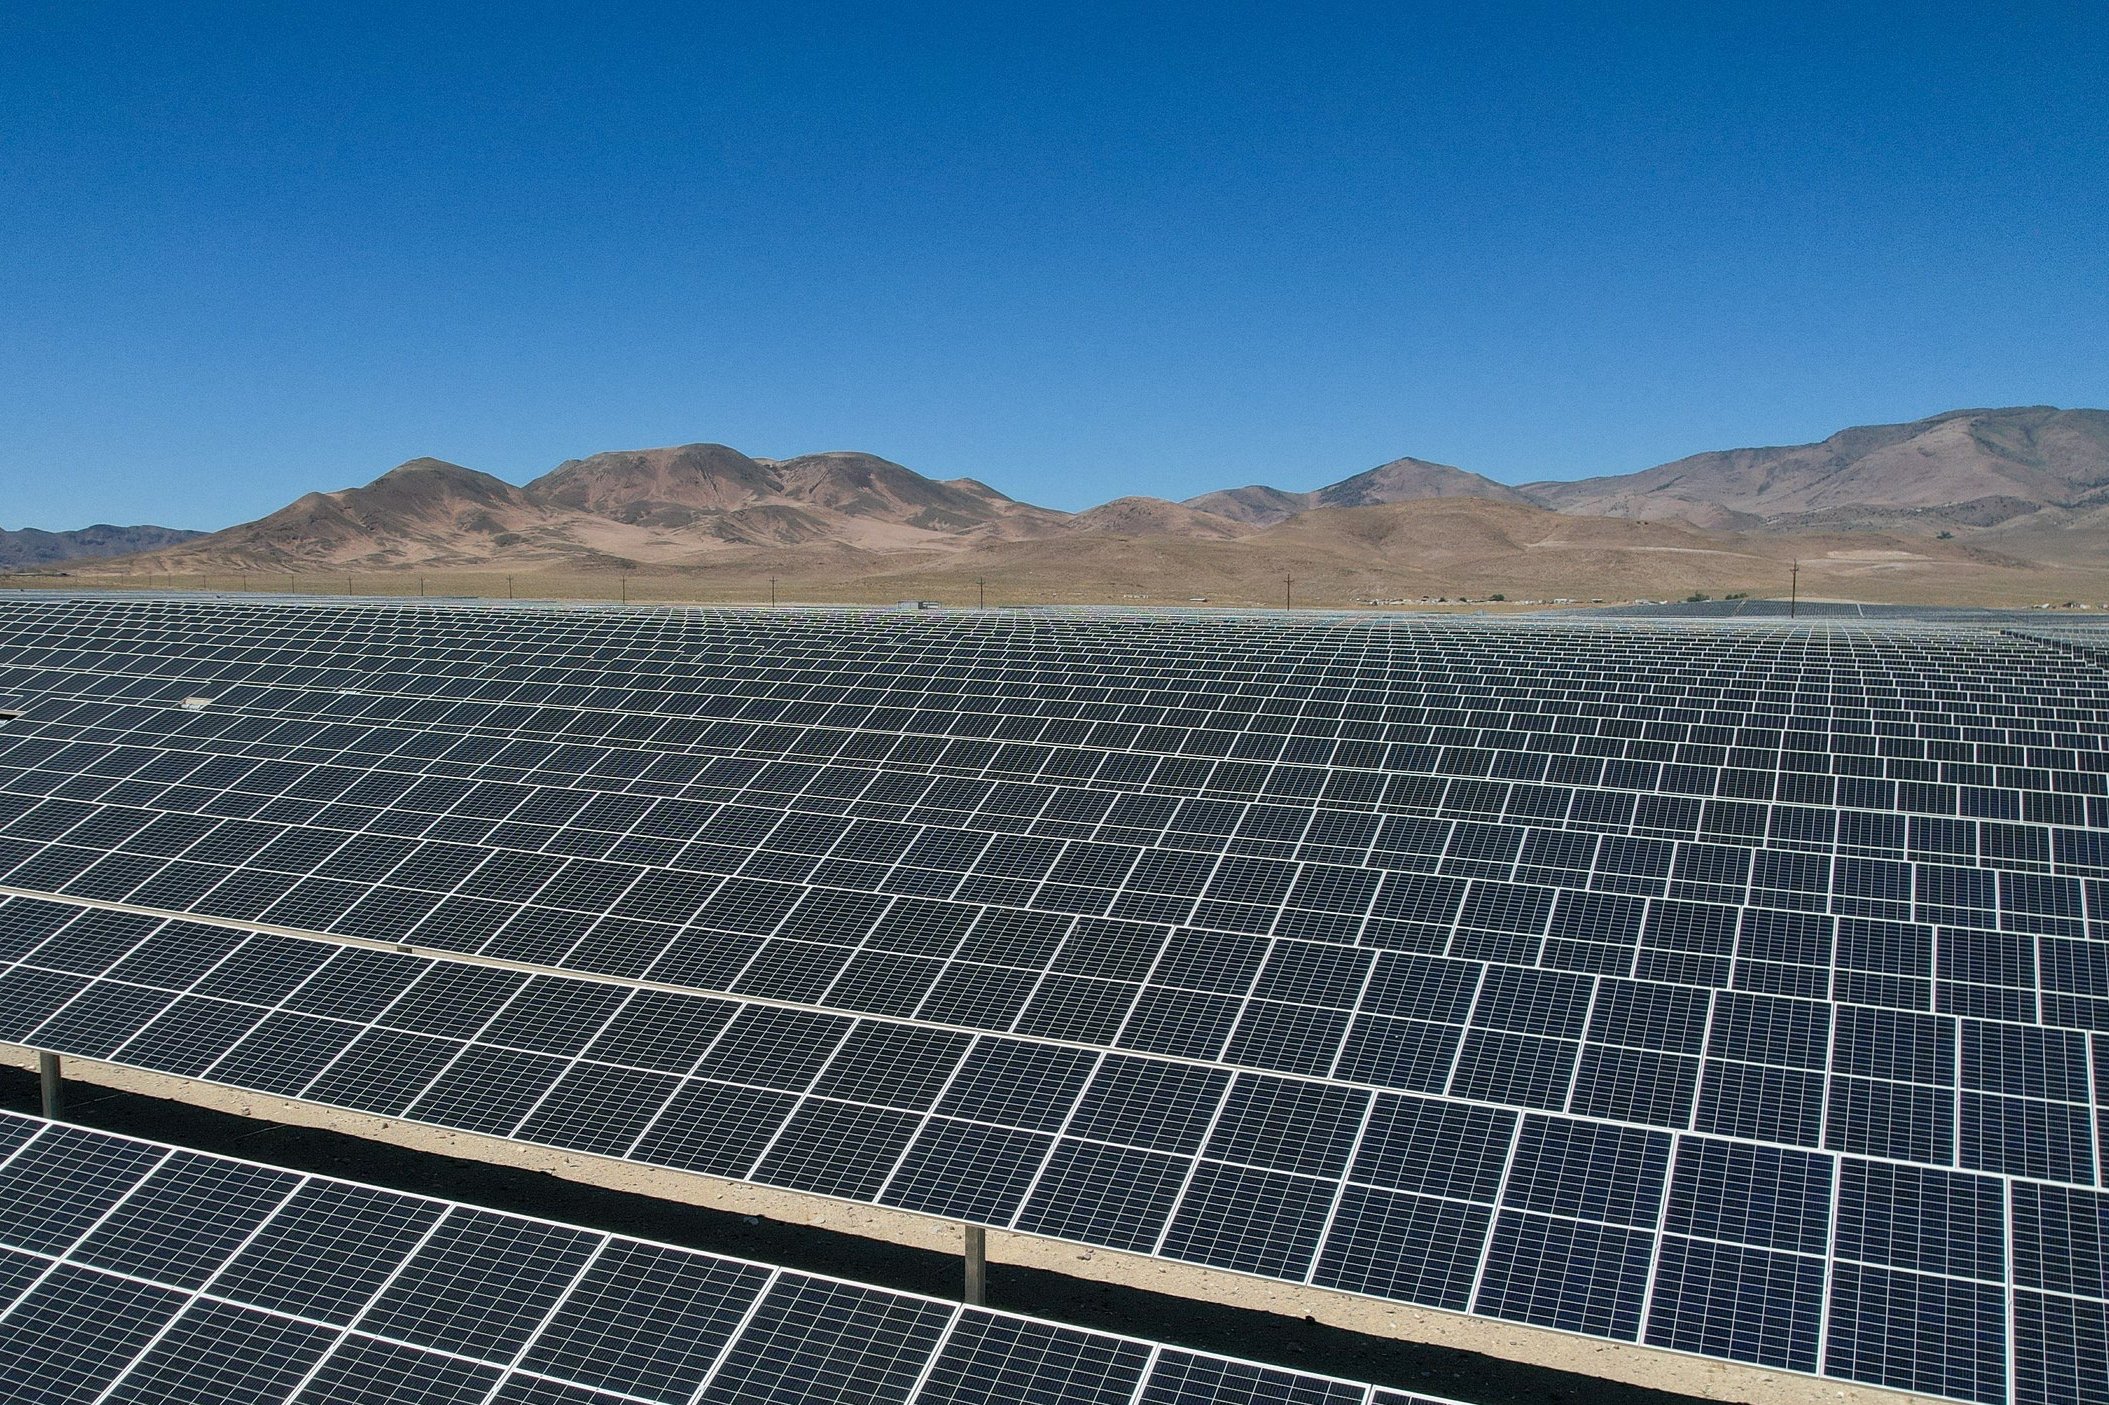
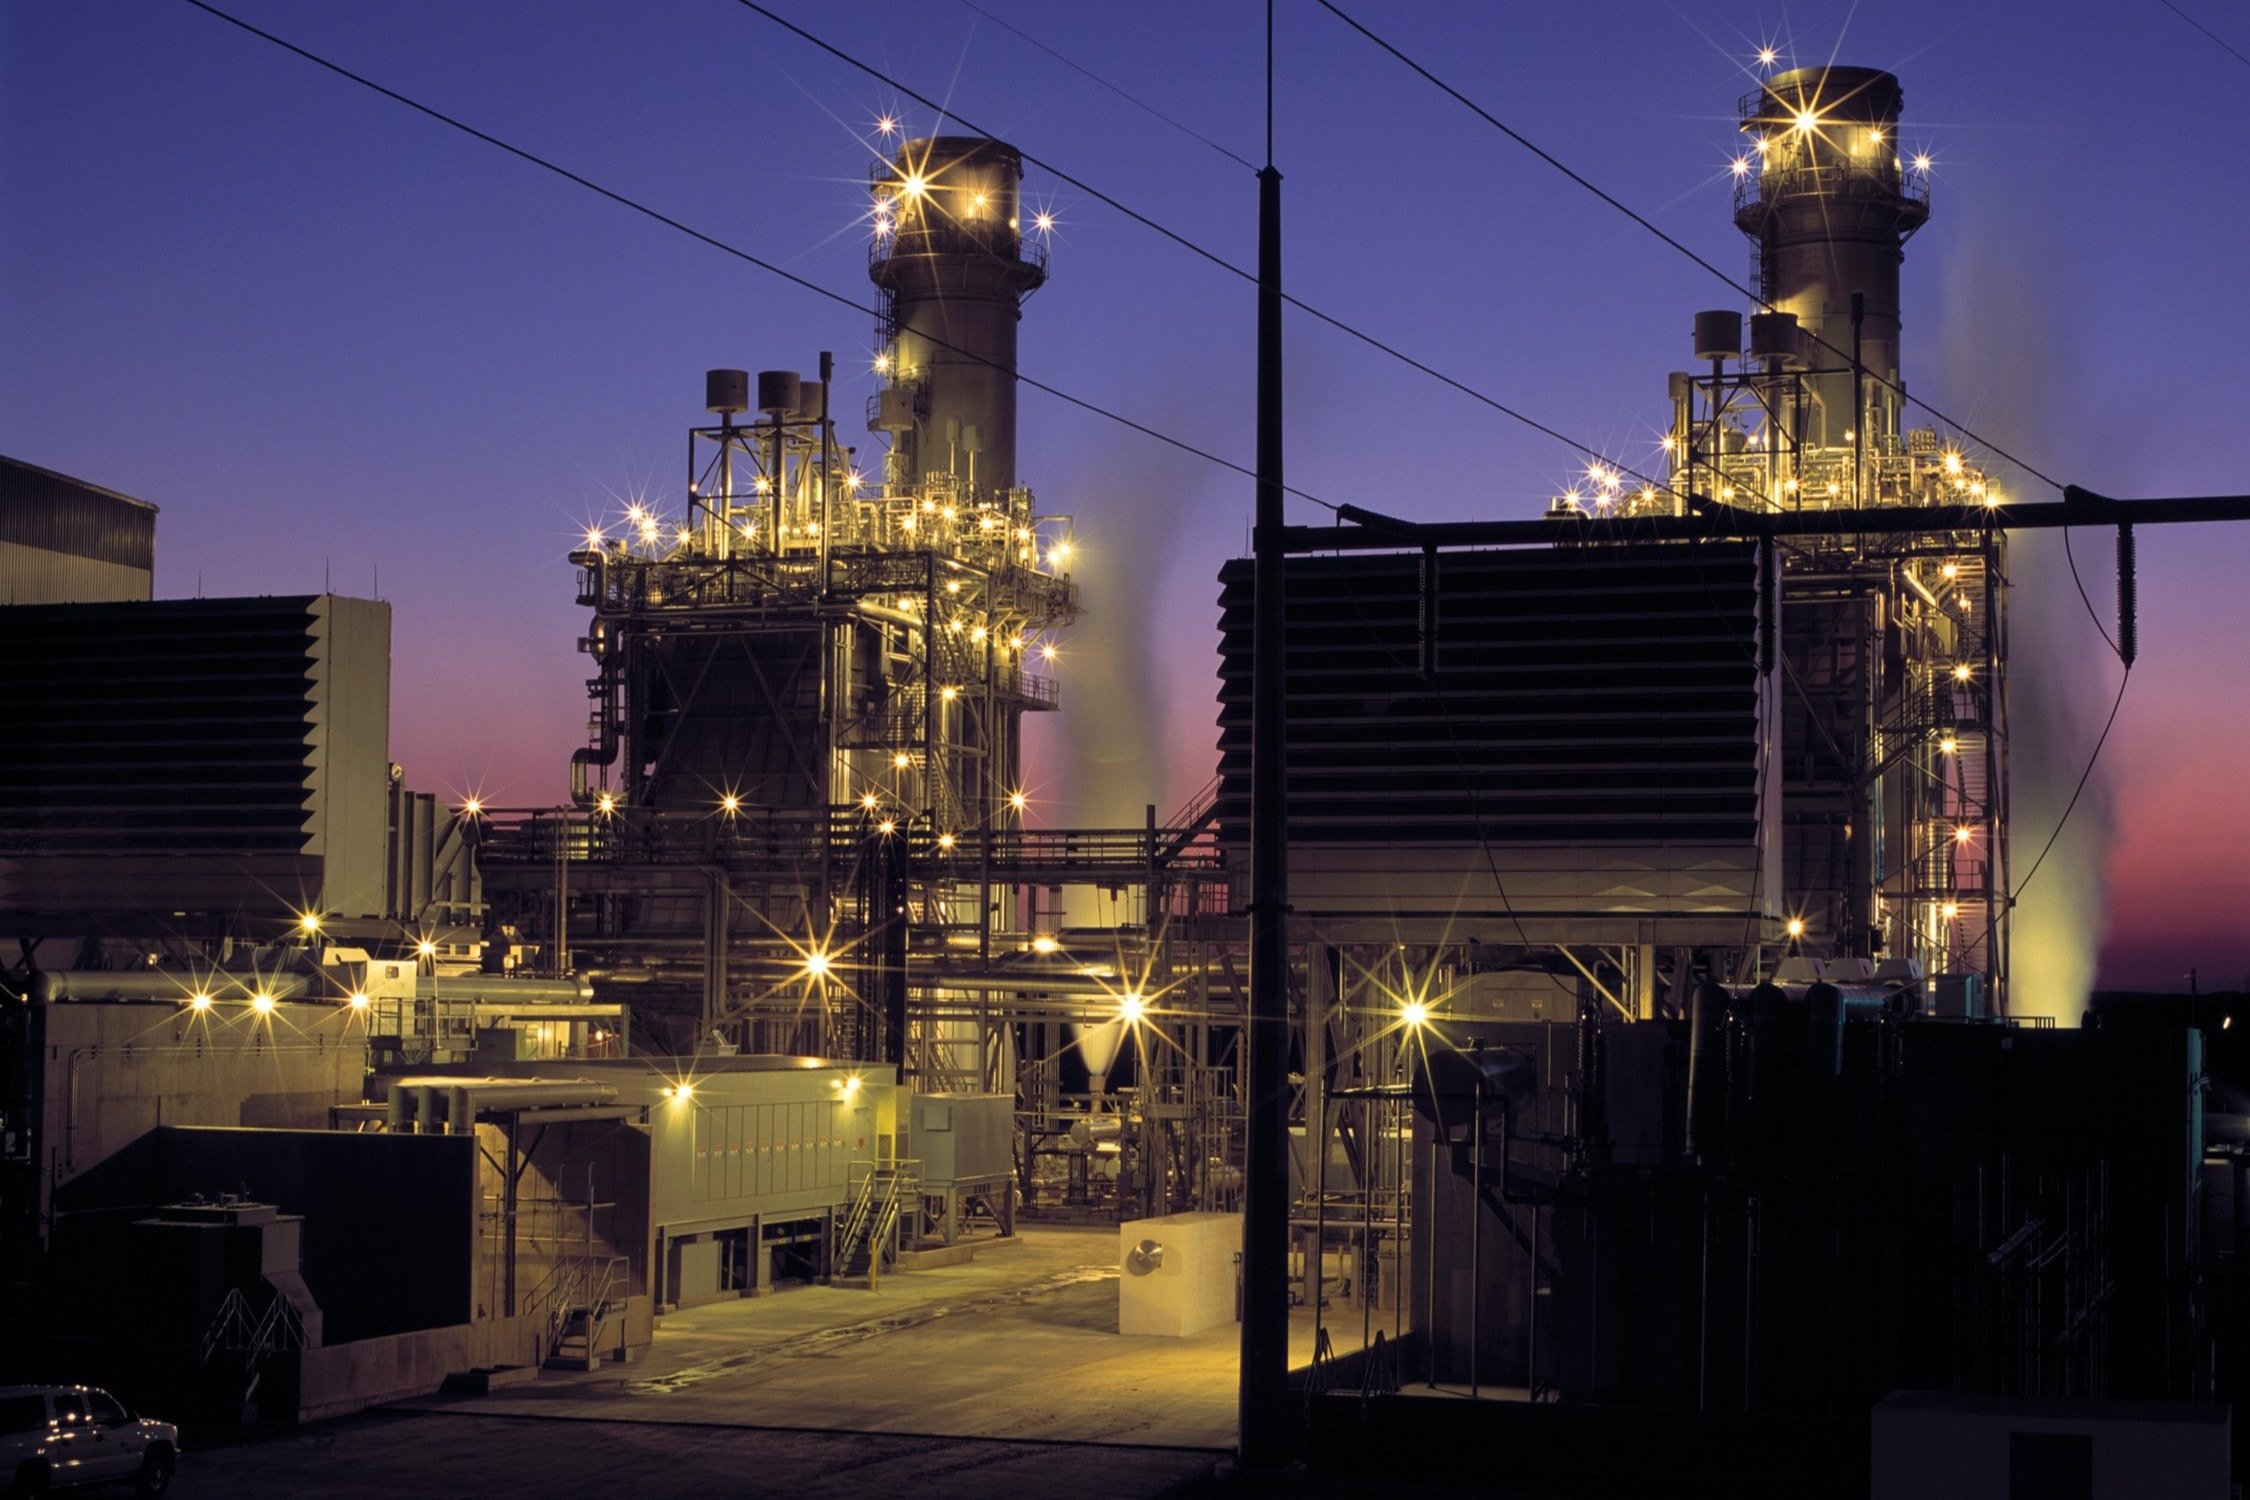
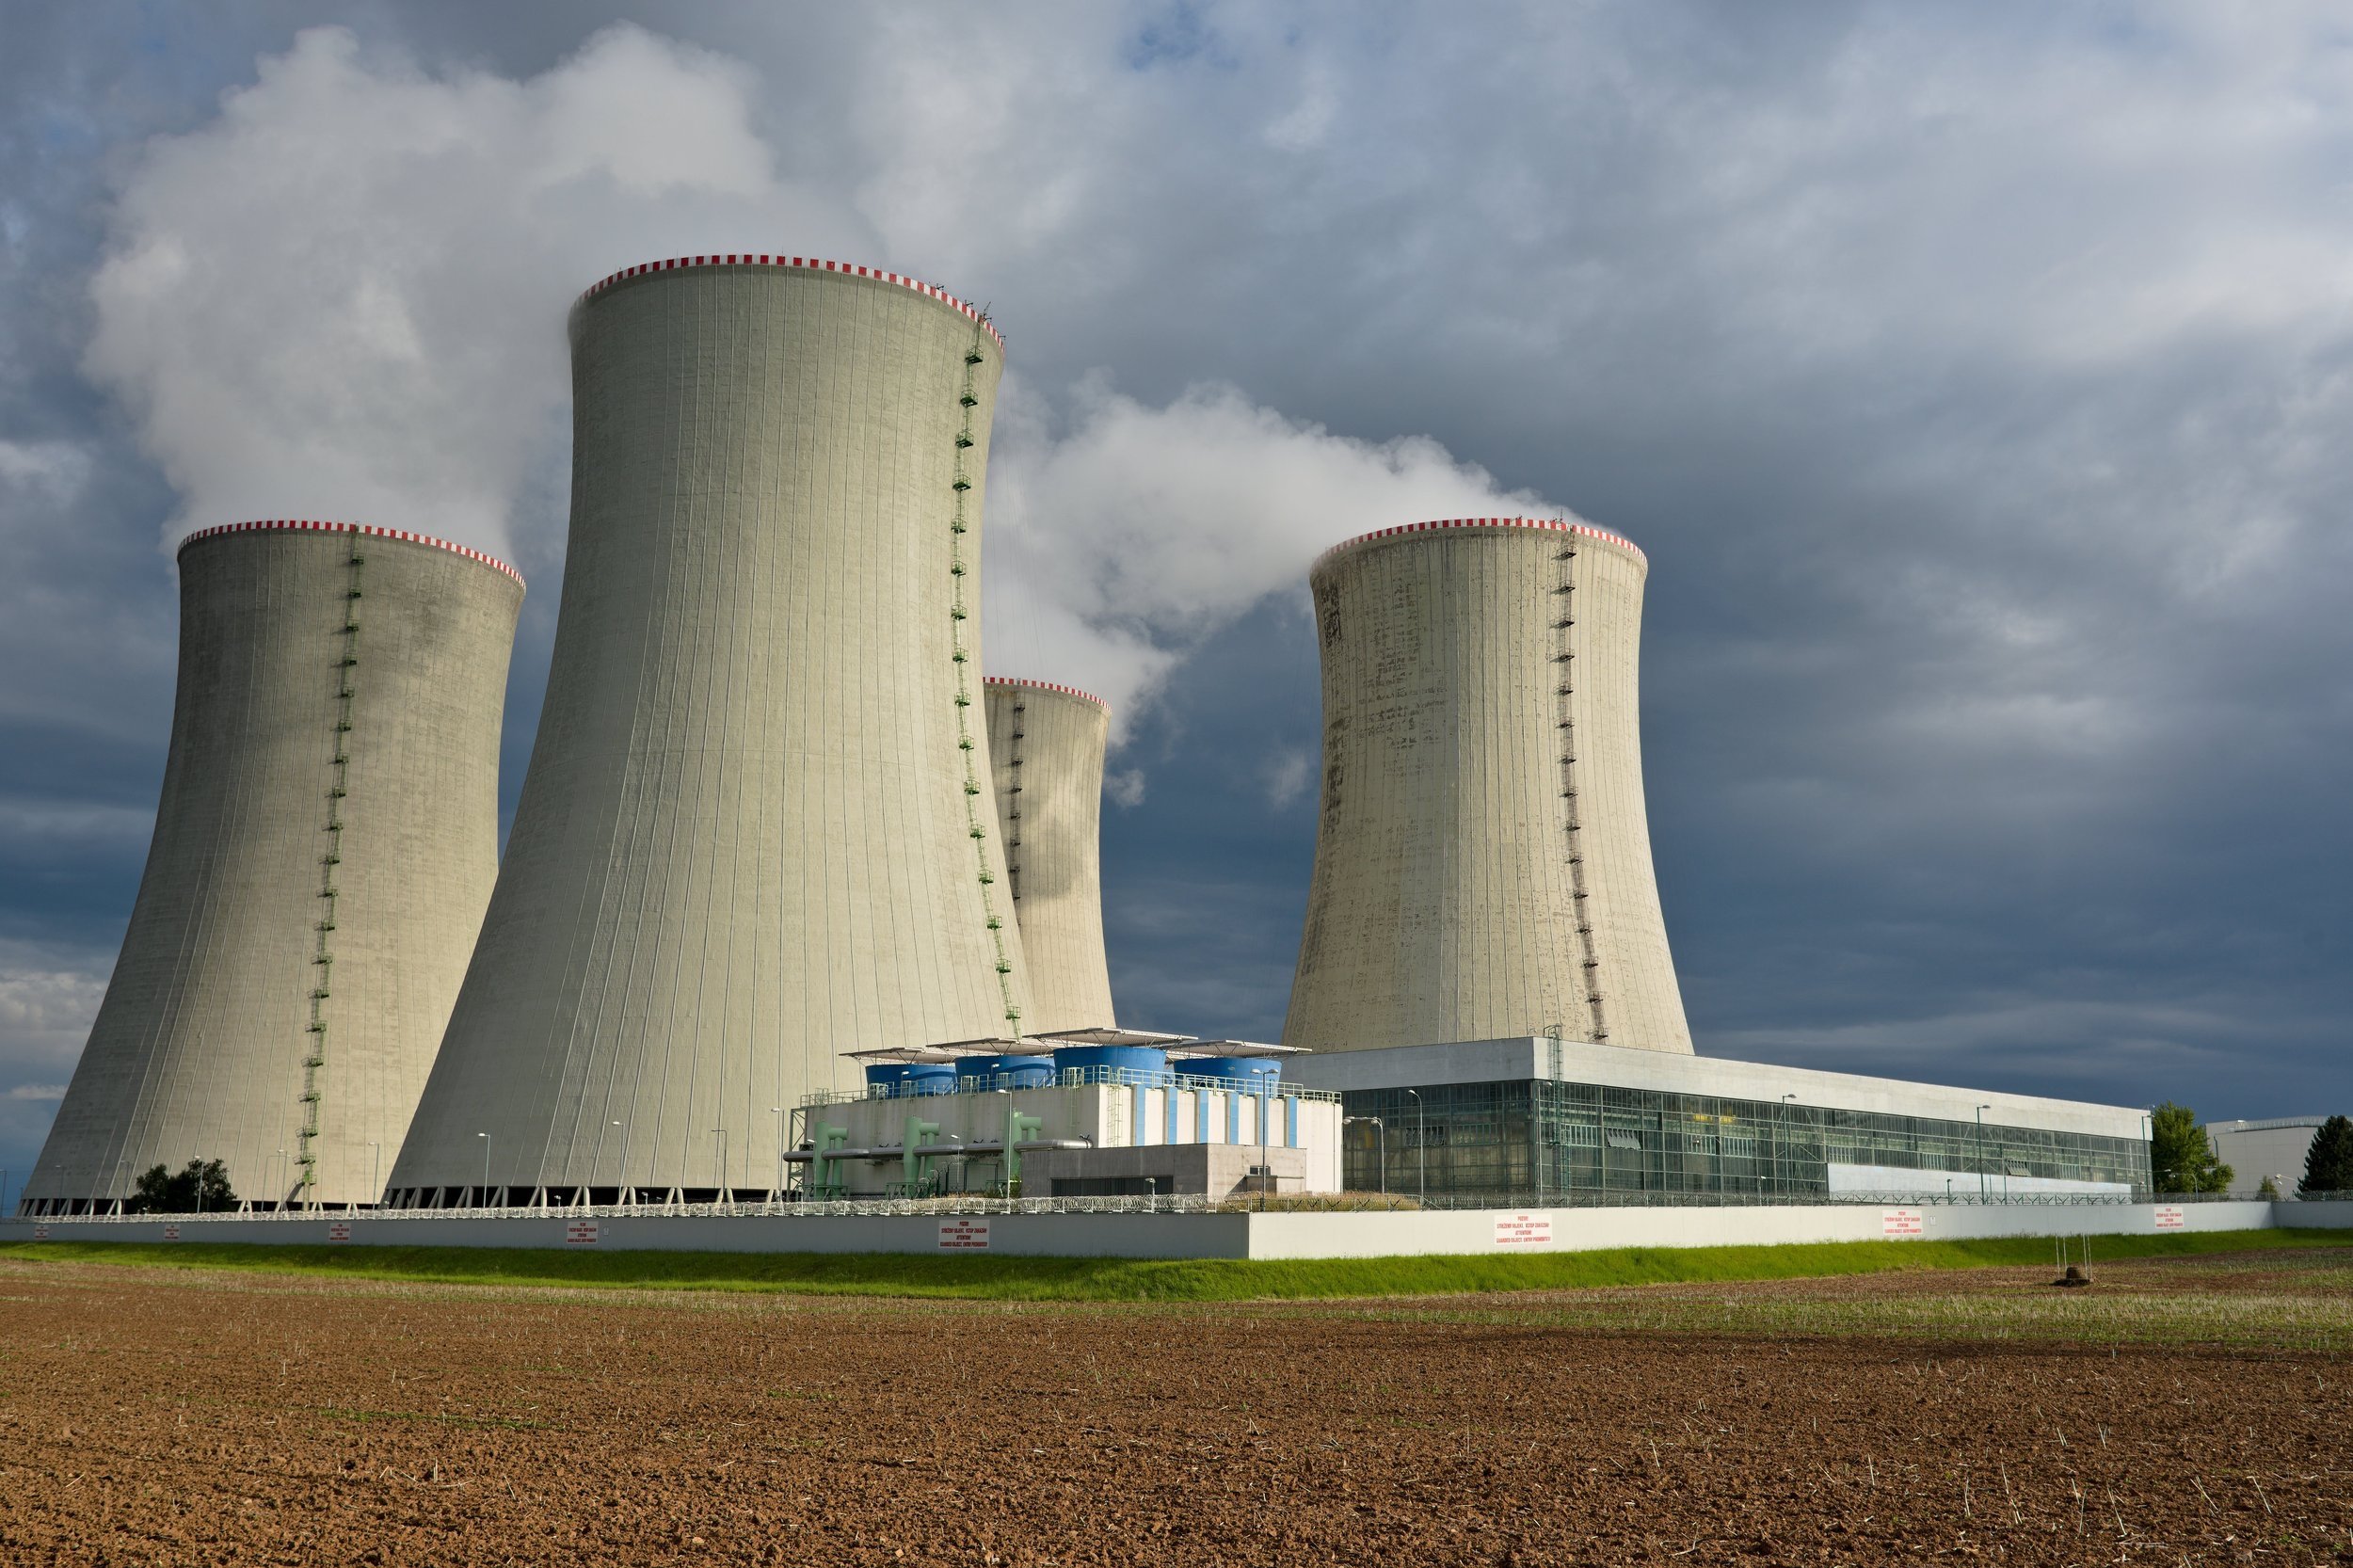
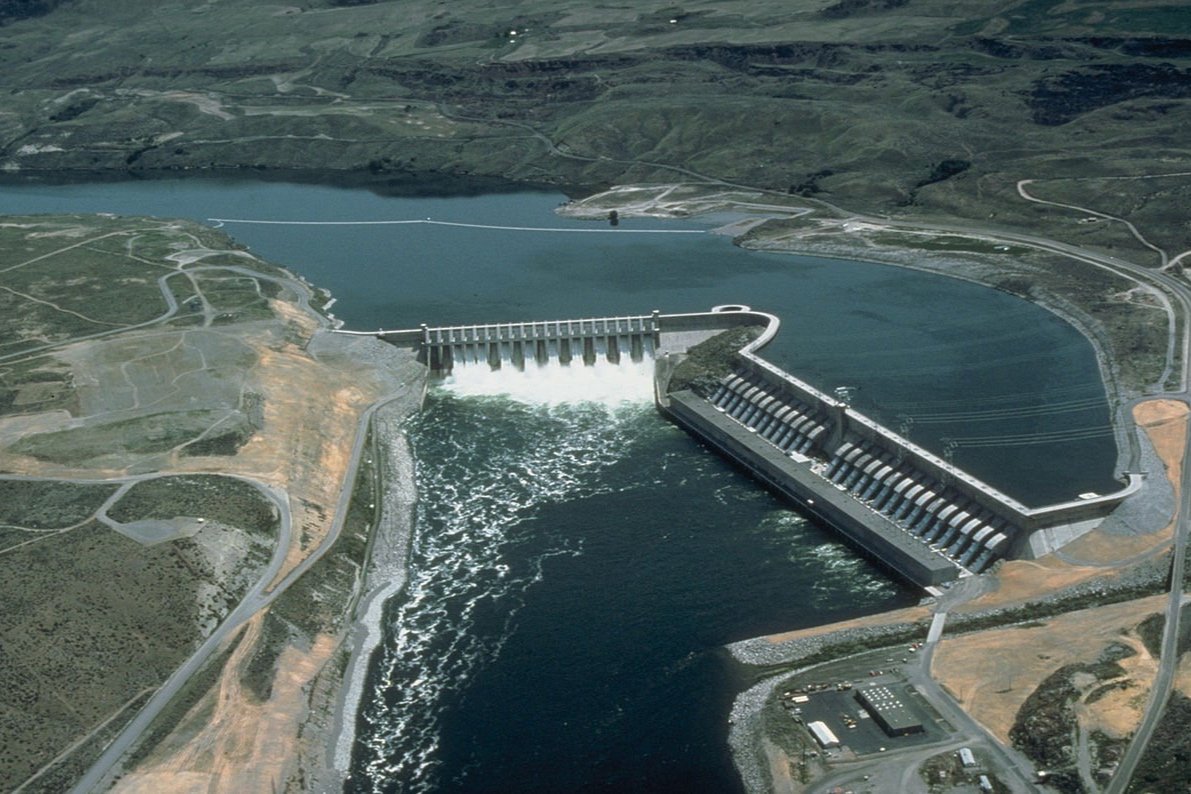
A gallery of primary sources of energy in the U.S.
People are often surprised to learn that power plants aren't always utility-owned. In the U.S., the ownership of power generation is nearly evenly split between utilities and independent power producers (IPPs). When it comes to renewables, however, IPPs dominate, owning over 80% of generation (excluding hydroelectric power from dams). This trend is largely a result of the deregulation of power markets from the 1980s to early 2000s and the surge in renewable energy (more on this below).
Over the last 20 years, independent power producers (IPPs) have increased their share of power generation from around 20% in 2000 to over 45% in 2022. This is a result of deregulation in the energy space, which has opened up competitive electricity markets that allow non-utilities to compete for selling energy.
Independent power producers (IPPs) own over 80% of renewable energy generation in the U.S. (excluding hydroelectric power, which often comes from older dams before market de-regulation that allowed IPPs to compete).
Shifting our discussion to the technologies that generate energy in the U.S., the data below is from the U.S. Energy Information Administration (EIA), highlighting how quickly the U.S. energy mix is shifting to renewables in the grid.
Renewable energy share of U.S. generation, in comparison to fossil fuels, nuclear, and hydroelectric.
Looking specifically at carbon-free energy (nuclear, hydroelectric, and renewables), we can see the rapid increase in wind and solar. In just 20 years, these resources have gone from supplying 0.05% of carbon-free energy to nearly 40% of it.
Wind & solar now account for roughly 40% of carbon-free energy in the U.S.
The Emerging Challenge as Supply Shifts to Wind & Solar
What’s happening: Traditional power plants like coal, natural gas, and nuclear can be turned on and off as needed, dynamically changing supply to meet the grid’s needs. Renewable energy from wind and solar, however, cannot be controlled in this manner.
These resources produce energy based on how much wind is blowing and how much sun is shining. Because of this, renewable energy output usually peaks in the middle of the day. Yet, demand in the grid peaks in the morning and evening, when people are using more energy at home.
Using some data from California’s grid (referred to as CAISO), we can highlight what this mismatch looks like on a typical day across the grid.
Energy supply from wind and solar by hour, 6/21/2023
Energy demand by hour, 6/21/2023
Combining these graphs, we get a useful metric called net demand (also referred to as net load), which is the total demand less supply from wind and solar. As we can see, wind and solar largely meet demand during the middle of the day (dark blue below), but almost none of it during the morning and evening hours.
Net demand by hour, 6/21/2023
So, what ultimately happens when abundant energy from wind and solar misaligns with demand in the grid in the middle of the day?
The Effects: Midday Price Drops, Fluctuating Emissions, and Excess Clean Energy
Areas of the grid with a high share of renewables—like California—are experiencing the following dynamics at increasing scale due to renewables:
Energy prices drop in the middle of the day, then rise in the morning and evening: Energy produced by wind and solar is generally cheaper than that from fossil fuels. When there is abundant renewable energy with low demand—like in the middle of the day—energy prices drop and can even go negative if supply exceeds demand.
Carbon emissions fluctuate: Because energy produced by renewables has no direct emissions, the carbon intensity of energy in the grid is much lower when there is a higher share of energy production from renewables. In the evening when renewables aren’t supplying energy, large fossil fuel plants turn on to meet demand, increasing carbon emissions.
Clean energy is wasted: On very sunny or windy days, the net generation from renewables can exceed demand, causing energy prices to go negative and sometimes forcing renewables to curtail (or restrict) their supply to the grid. This results in wasted clean energy that the grid is unable to use.
To illustrate these dynamics, we can explore some more data from California’s grid, specifically focusing on energy prices and carbon emissions.
Low-cost, clean energy floods the market in the middle of the day, reducing prices when demand is low. Yet, as demand picks up in the morning and evenings, there is less renewable energy available. This causes noticeable spikes in energy prices. (Note: Data from sample of 80 power nodes in CAISO from all of 2022.)
Energy produced in the morning and evening comes from more carbon-emitting resources. Looking at the emissions per MWh for each hour of the day, we see that energy in the middle of the day is significantly cleaner than energy in the morning and evening.
The Case for Energy Storage: Large Batteries That Store Excess Energy in the Grid
As we think about powering the grid with 100% clean energy, we’ll need more and more wind and solar with less fossil fuels. Yet, wind and solar aren’t always producing energy and can’t directly power the morning and evening demand peaks. There’s three resulting trends from this dynamic:
Rapidly increasing renewable energy production, misaligned with demand
More excess renewable energy in the middle of the day
Increasing opportunity to store excess clean energy for later use
What if we could store this cheap, clean energy in the middle of the day from renewables, and use it to power the grid during the rest of the day? That’s exactly the motivation behind energy storage. Consider what this storage-enabled grid would look like in terms of both supply throughout the day and the resulting effect on emissions:
100% Clean Energy Supply with Storage
With sufficient renewable supply in the middle of the day, and sufficient storage of that clean energy for later use, the carbon intensity of energy in the grid will drop at all hours of the day.
Reduced Emissions with Storage
Since renewables aren’t always able to produce energy, we need sufficient supply in the middle of the day such that the excess energy is enough to store and power the grid for the remaining hours.
The Rise of Energy Storage: Meteoric Growth Fueling More Clean Energy
Propelled by the rapid increase in renewables and the ensuing challenges they’re creating in the grid, large batteries are the newest—and fastest growing—type of energy asset. These systems are commonly referred to as Battery Energy Storage Systems (BESS), distinguishing them from hydroelectric energy storage (dams).
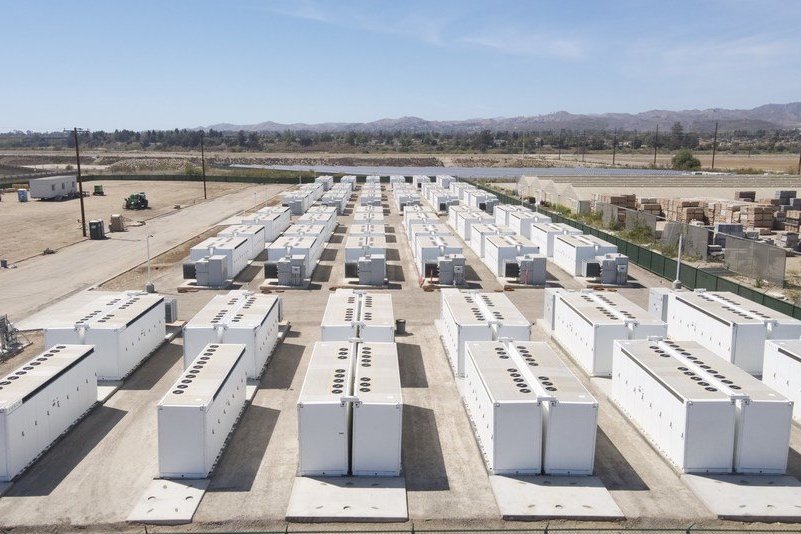
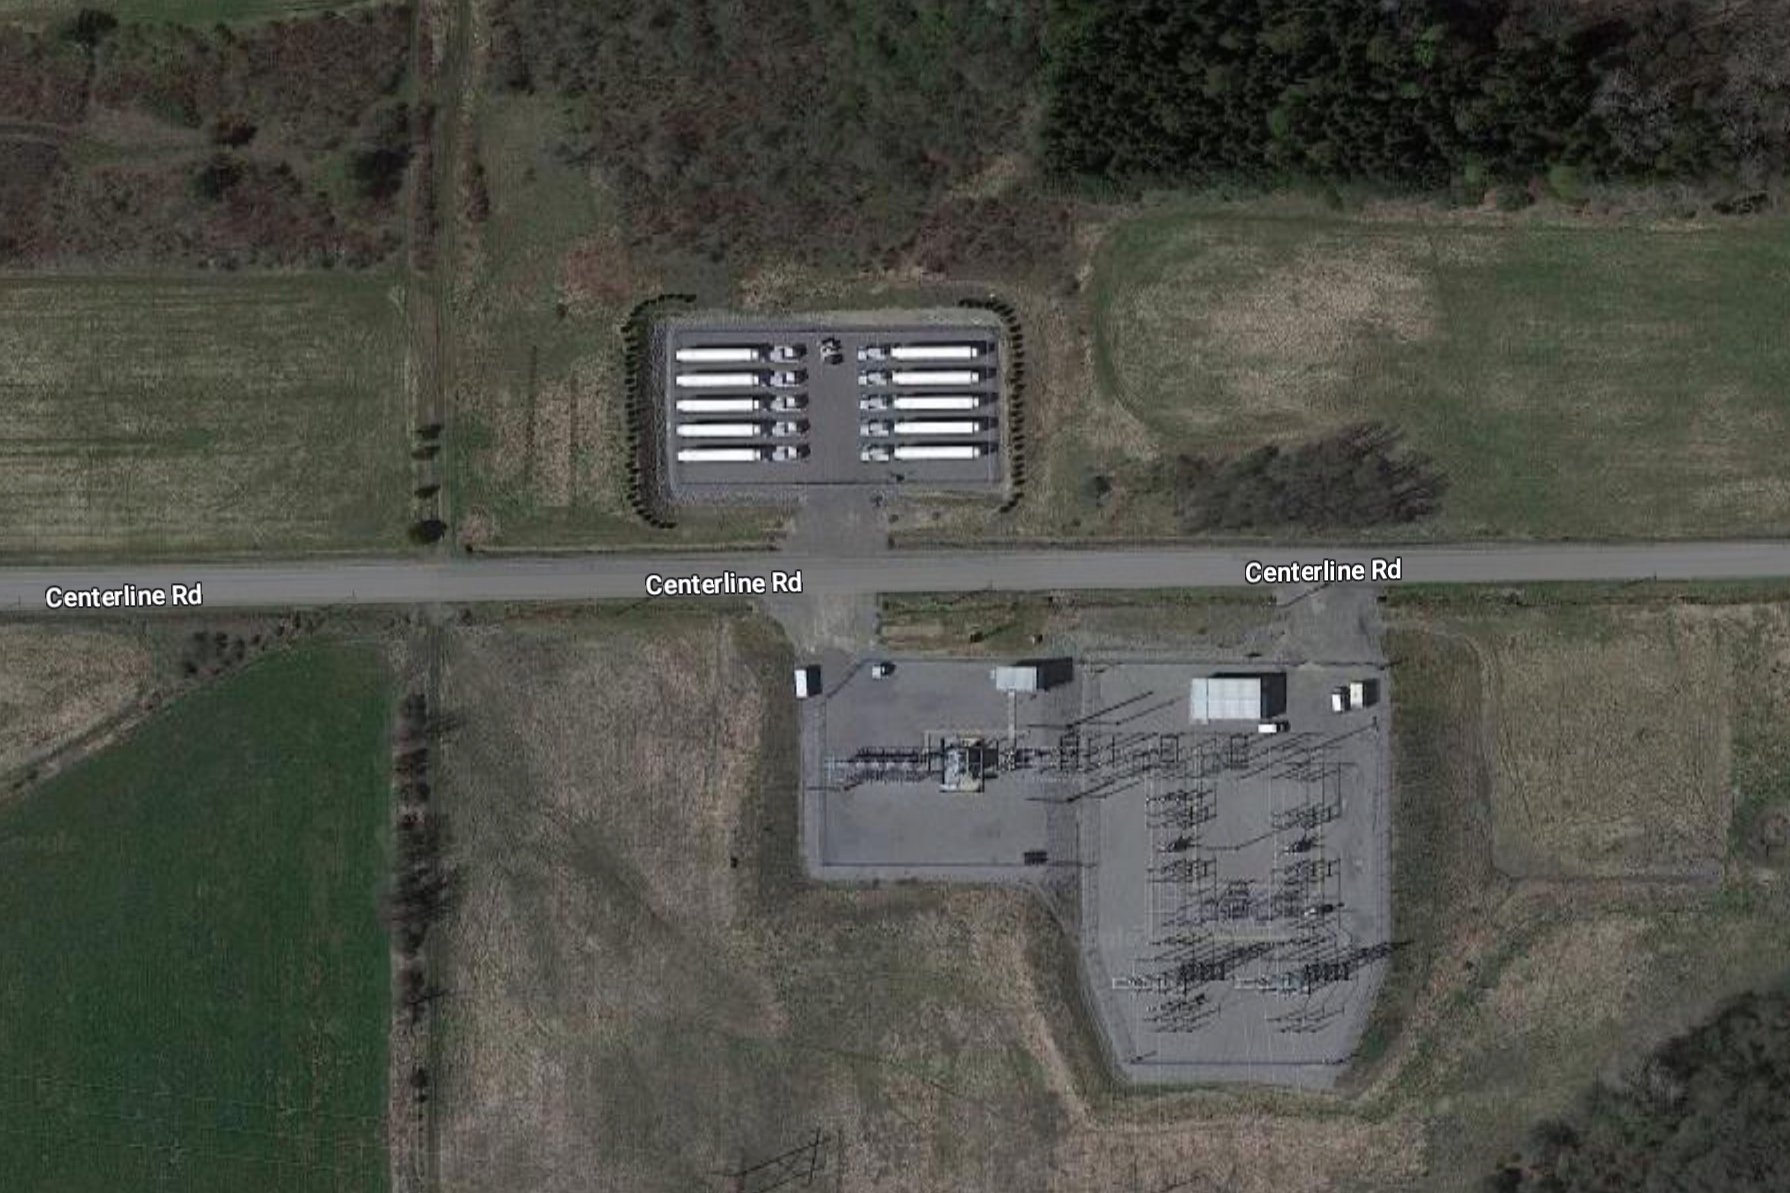
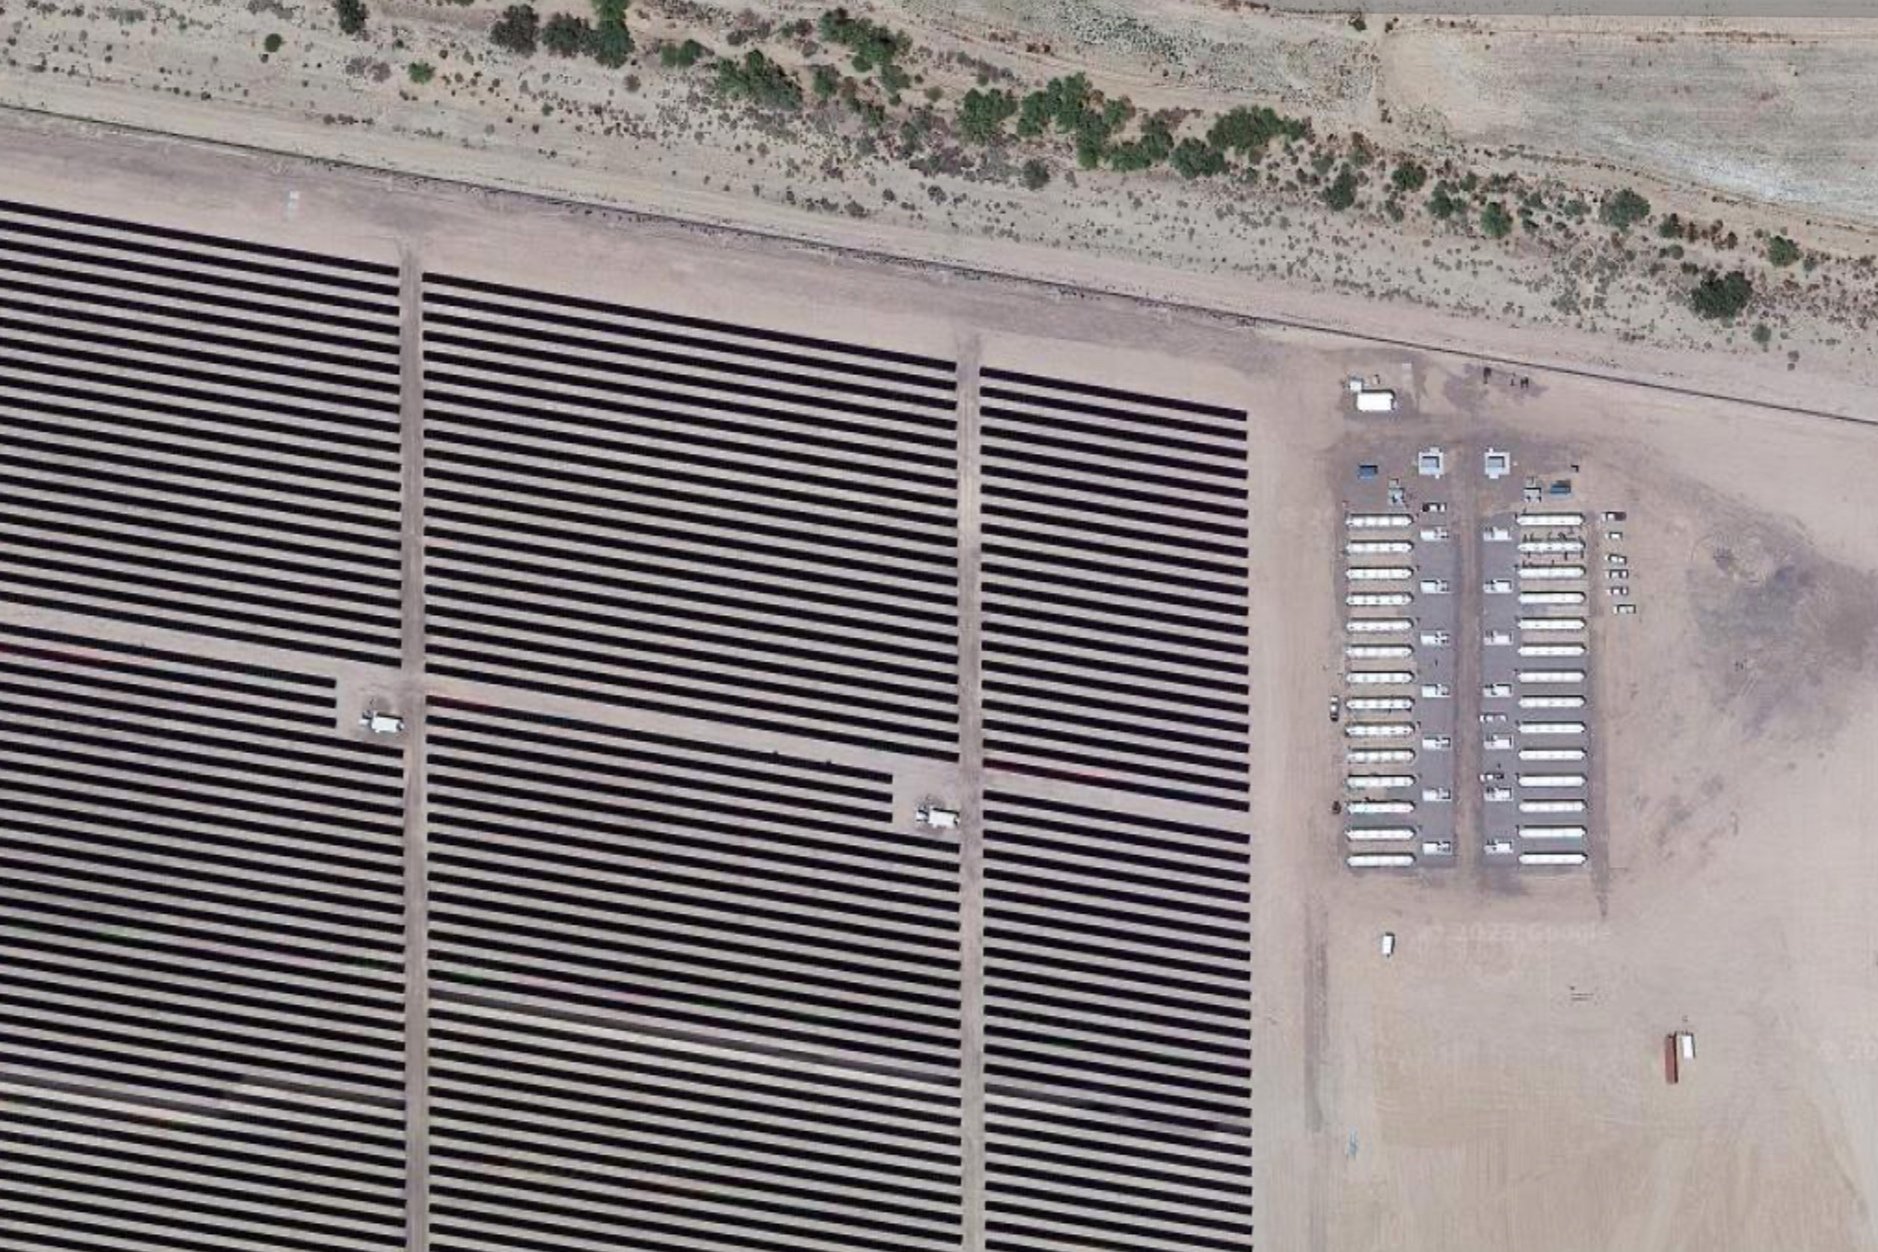
A typical BESS system, a standalone installation, and a co-located installation.
Internally, these systems are comprised of thousands of battery cells (think AA batteries), combined into modules (groups of cells), which are grouped together to form packs (groups of modules), which are then placed together in containers to form the BESS system (groups of packs).
Inside a Battery Energy Storage System (BESS)
A diagram showing the components of a large battery system.
Energy storage provides immense value to the clean energy transition in the grid. Accordingly, there’s a massive increase in planned battery installations across the U.S. power market. Looking at data from the U.S. Energy Information Administration (EIA):
Planned battery installations in the U.S. (as of May 2023)
What are these batteries actually doing in the grid? Looking at data from California, we can see how batteries charge and discharge energy throughout the day. Negative values indicate times that batteries are charging from the grid, and positive values indicate times that batteries are discharging energy into the grid. Batteries are storing cheap, clean energy from off-peak hours and sending it back to the grid when there is higher demand.
Batteries are storing energy to use in the morning peak, then storing even more energy in the middle of the day to use in the evening peak.
As more renewables enter the grid, batteries get more chances to store cheap, clean energy in the middle of the day and send it back to the grid during periods of higher demand. Looking at prices year-over-year for March in California—the month where renewables meet the largest share of demand—we can visualize this increasing opportunity:
Each year, as the amount of renewable generation increases in California, the spread in prices between the middle of the day and peaks in the morning and evening increases.
Lastly, to highlight just how drastic the increase in battery participation in the grid has been, we can look at the amount of battery capacity charging and discharging year-over-year from 2020 to 2023.
Using the same day (June 21st) from the data above on supply, demand, emissions, and batteries, we can see how significant the increase in battery participation has been from 2020 (near zero) to 2023 (now exceeding 3GW of peak discharge).
Hardware is Only Half of the Story
Once a large battery is connected in the grid, it doesn’t automatically buy, store, and sell energy in the most useful way—code is involved at nearly every step of the operation.
Breaking down the key roles of code for energy storage:
Code touches nearly every aspect of energy flow in the wholesale electricity market.
Battery Management
Code running inside of the battery determines how much power the battery can charge or discharge at any moment, as well as how much energy the battery can store over its life. These values are based on the real-time conditions of the underlying hardware (primarily, the battery cells).
If we were to use an analogy of a race car, this would be code that ensures the car is in its best shape to run the race—irrespective of who's driving it and the rules of the race.
The objective: Safely and reliably operate the battery cells, while trying to maximize the amount of energy can hold over its life (called State of Health, or SOH). The more performance this code can extract from the underlying hardware, the more the battery can be used in the grid.
Types of code: Real-time controls, performance analytics, APIs for energy management, data science for optimization, data engineering for managing all this data.
Energy Management
Based on information about a specific battery and what’s happening in the grid, energy management code determines when the battery should buy or sell energy, how much it should purchase, and at what price.
Continuing the analogy of the race car, this would be the driver who decides how to best drive the race car based on the other drivers in the race, the rules of the race, and the performance of their car (improved by better code in the battery management system).
The objective: Determine the strategy of the battery, deciding when and how it should charge or discharge energy to maximize its impact and value in the grid.
Types of code: Machine learning, real-time bidding controls, performance analytics, grid data ingestion, cloud deployment, software interfaces, API integration to battery management, API integration to electricity markets, data science for optimization, data engineering for managing all this data.
Grid Management
At the highest level, the grid operator uses code to consider all submitted energy bids then determines who gets to charge or discharge, in what quantities, when.
Completing our race car analogy, this is the organization that runs the race. They determine who gets to drive—as well as the rules of the race—with the goal of ensuring a smooth racing experience for both drivers and spectators.
The objective: Ensure the efficiency and reliability of the grid by best determining how energy flows between supply and demand, based on real-time market bids, day-ahead bids, and forecasts of grid state.
Types of code: APIs for market participants, market optimization functions, machine learning, performance analytics, grid data servicing, cloud deployment, software interfaces, data science for optimization, data engineering for managing all this data.
Better Code Enables the Grid to Run on More Clean Energy
Given the direct role of code in all of these functions to enable energy storage hardware to buy, store, and sell clean energy in the grid, it’s crucial that the grid—and more importantly, energy assets in it—run on the best code possible.
To add one more angle to the value of code for clean energy, consider the larger picture of solving climate change. We’re currently constrained on how much clean energy infrastructure we can install due to supply chain limitations and permitting bottlenecks in the grid. As a result of this, we need to ensure that every battery installed is providing the maximum value it can to the grid. This primarily happens via better code.
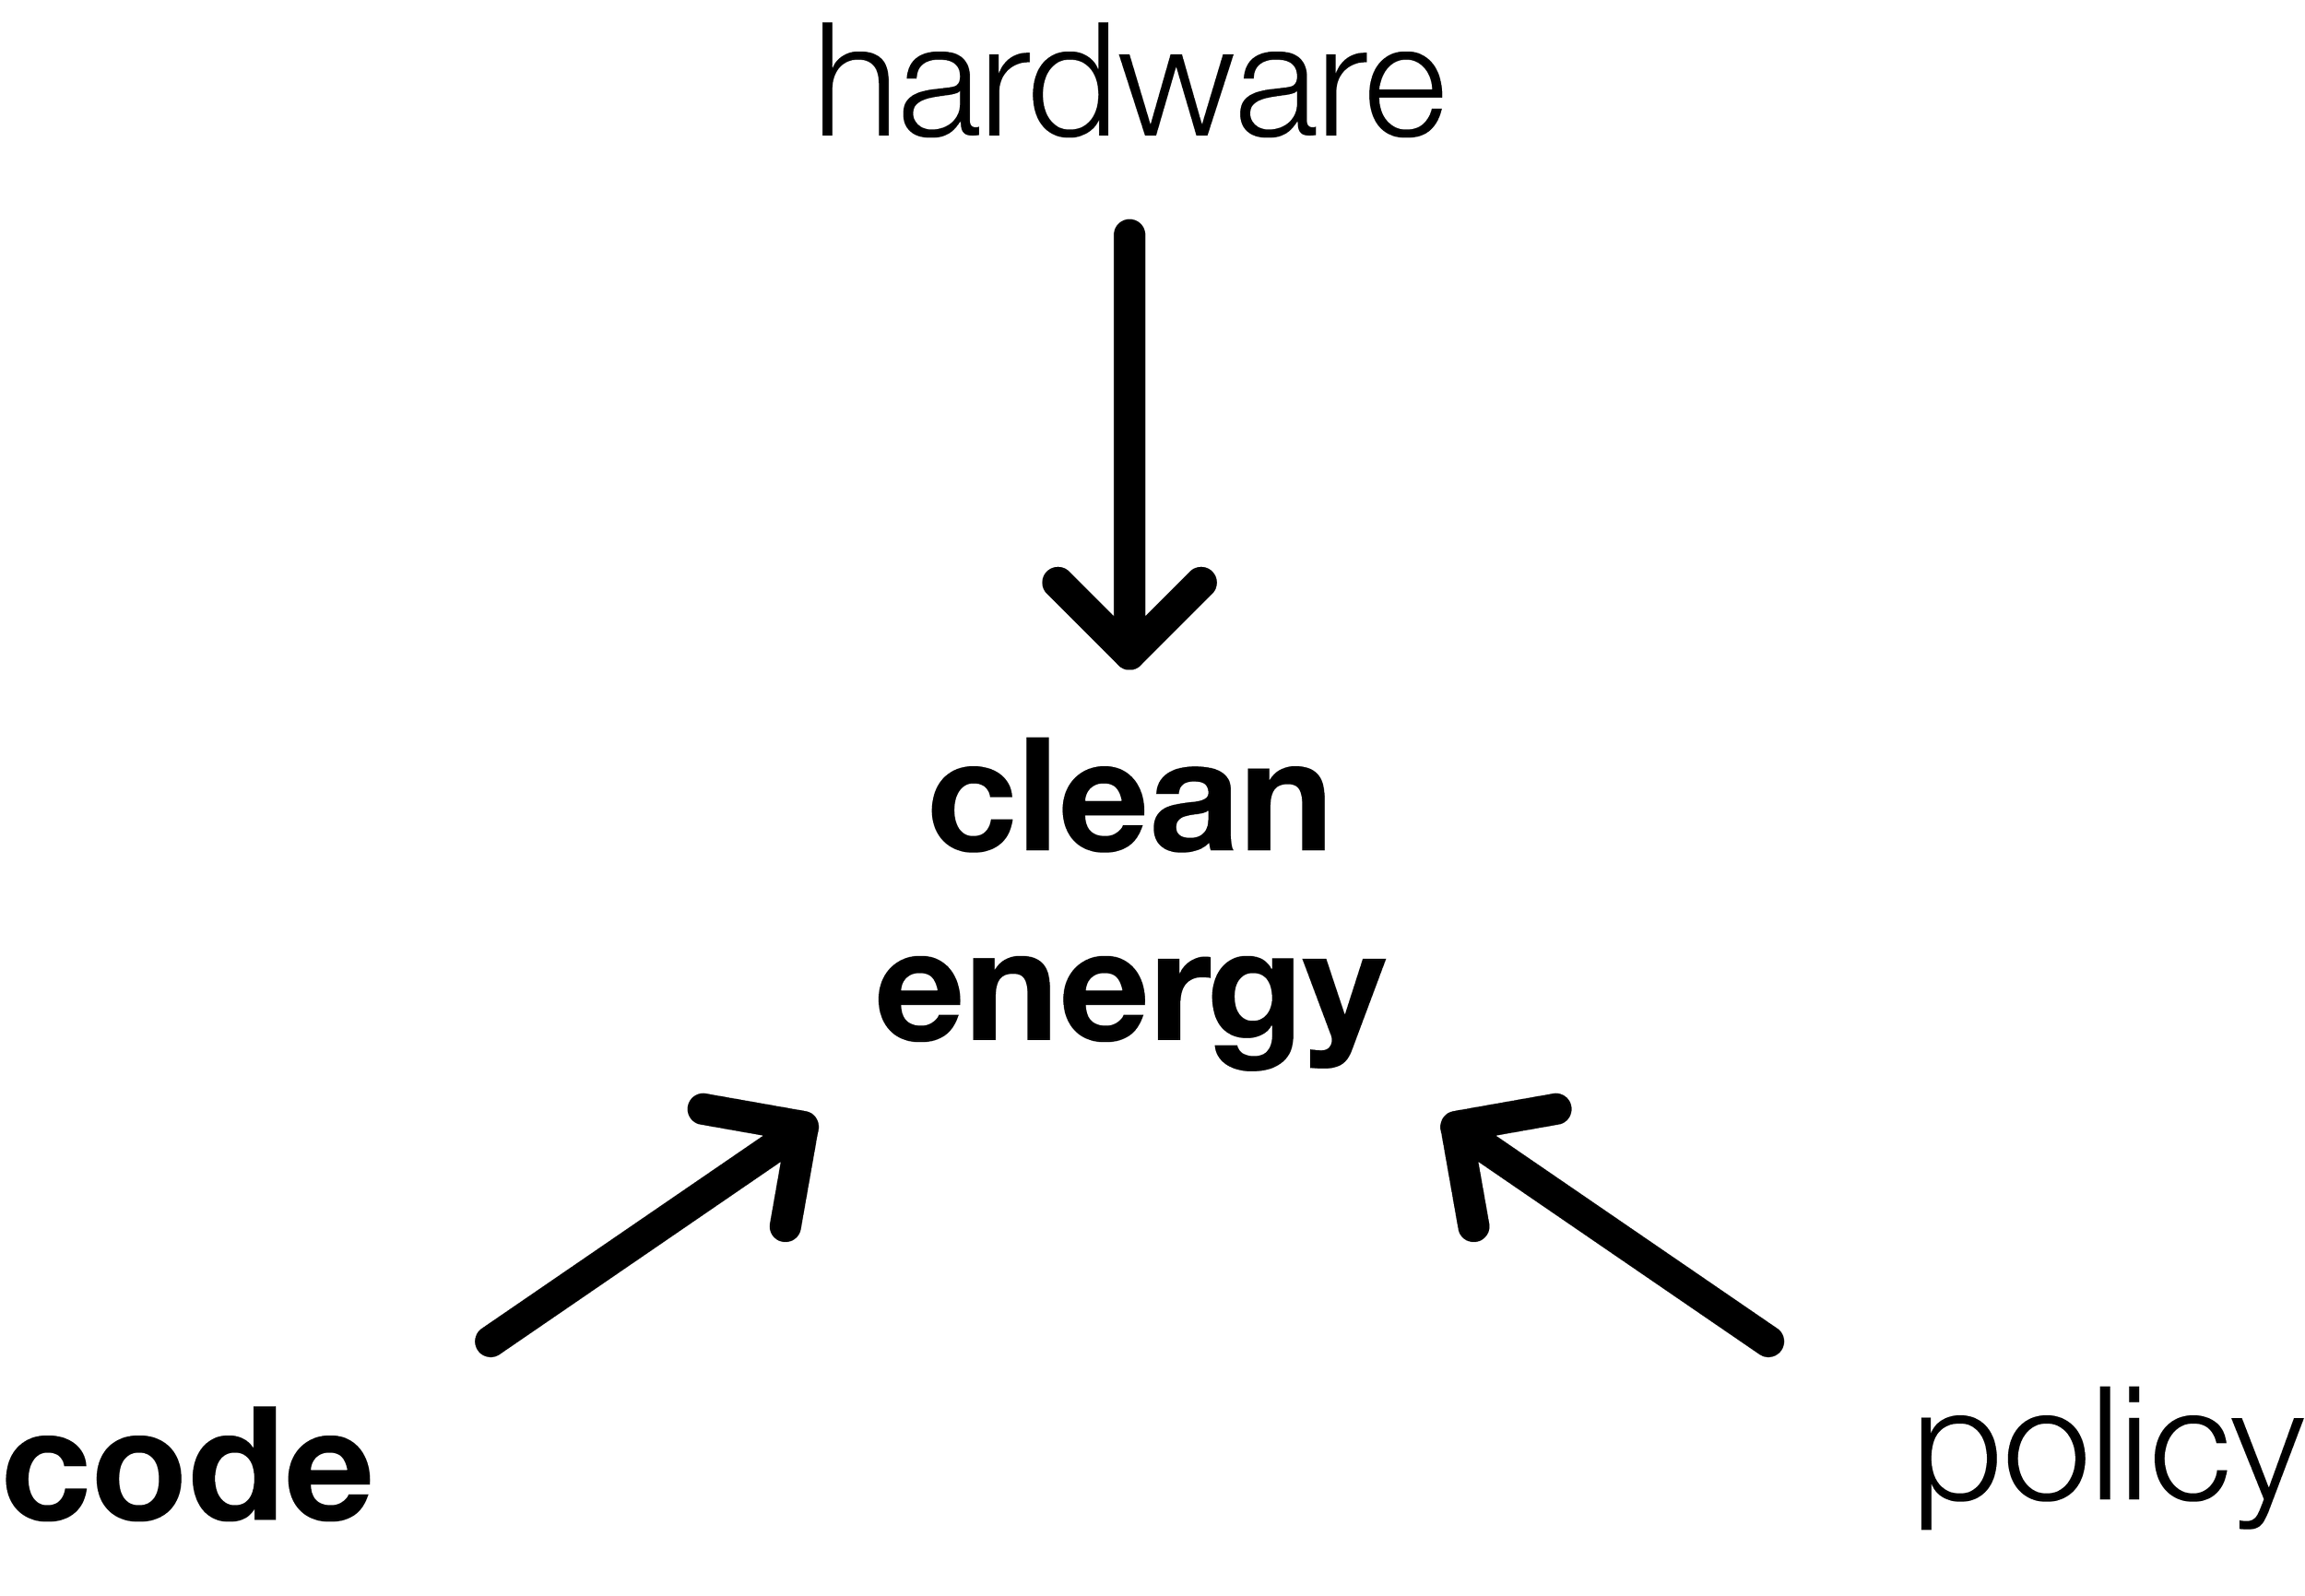
Code is crucial to the clean energy transition, bringing life to the hardware behind it and execution to the policy that encourages it.
The interplay of code, hardware, and policy in the clean energy transition.
Conclusion
To write the best code in the grid, we need the best programmers turning their attention to this space, and for that to happen we need them to understand the problems, drivers, and opportunities for coding in the grid.
We’ve covered:
How the grid actually moves energy with electricity markets
The rapid transition of energy supply to renewables
The challenges that renewables create with supply and demand, and the resulting effects on energy prices, emissions, and grid efficiency
The motivation for energy storage, how it works, and its rapid adoption in the grid
How code directly controls energy storage, determining how clean energy is stored in the grid to reduce emissions and enable more renewables
If you’re interested in joining us to write code to enable more clean energy in the grid, you can find our active job postings here, and learn more about what we do here.
Sources & Data
Data Sources for Figures in This Article
Share of Generation by IPPs and Utilities:
“ELECTRICITY DATA BROWSER - Net generation - 1.2.a & 1.2.b.” U.S. Energy Information Administration. Accessed July 14, 2023. https://www.eia.gov/beta/electricity/data/browser
Renewable Energy Supply Mix:
“TOTAL ENERGY - Data - Table 7.2b Electricity Net Generation: Electric Power Sector.” U.S. Energy Information Administration. Accessed July 11, 2023. https://www.eia.gov/totalenergy/data/browser
Supply, Demand, Emissions, and Battery Data in CAISO:
“Today’s Outlook - Supply” California ISO. Accessed July 11, 2023. https://www.caiso.com/todaysoutlook/Pages/supply.html
“Today’s Outlook - Demand” California ISO. Accessed July 11, 2023. https://www.caiso.com/todaysoutlook/Pages/index.html
“Today’s Outlook - Emissions” California ISO. Accessed July 11, 2023. https://www.caiso.com/todaysoutlook/Pages/emissions.html
Historical Pricing Data in CAISO:
This data comes from one of our private datasets, compiled from public historical CAISO pricing data.
Existing & Planned U.S. Battery Capacity
“ELECTRICITY - Preliminary Monthly Electric Generator Inventory (based on Form EIA-860M as a supplement to Form EIA-860) - May 2023 Report.” U.S. Energy Information Administration. Accessed July 14, 2023. https://www.eia.gov/electricity/data/eia860m/
Energy Agencies to Know
Most grid and electricity data is actually public in the U.S. Below is a quick primer on some key entities and governing bodies in the U.S. that provide data:
FERC: The Federal Energy Regulatory Commission is the parent U.S. government agency that regulates the transmission of electricity, natural gas, and oil.
ISOs/RTOs: Independent System Operators (ISOs) and Regional Transmission Organizations (RTOs) are not-for-profit, government-run entities that manage the day-to-day operation of electricity markets and regional transmission grids. An example is the California Independent System Operator (CAISO).
U.S. EIA: The U.S. Energy Information Administration is a government agency that shares independent, impartial data on energy in the U.S. to drive better policymaking and public understanding of the energy space.
U.S. DOE: The U.S. Department of Energy is a government agency that plays a large role in driving energy policy, and also manages the country’s nuclear security.

